As you already know, when someone writes code in a high-level language there are two types of errors that he or she might make—syntax errors and logic errors. Eclipse provides all the necessary tools to help you debug your programs and find the errors.
Debugging syntax errors
Fortunately, Eclipse detects syntax errors while you are typing (or when you are trying to run the project) and underlines them with a wavy red line as shown in Figure 1.
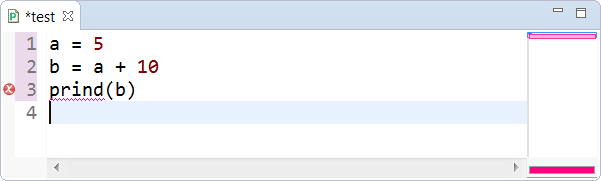
Figure 1 In Eclipse, syntax errors are underlined with a wavy red line
All you have to do is correct the corresponding error and the red line will disappear at once. However, if you are not certain about what is wrong with your code, you can just place your mouse cursor on the erroneous line. Eclipse will try to help you by showing a popup window with a brief explanation of the error, as shown in Figure 2.
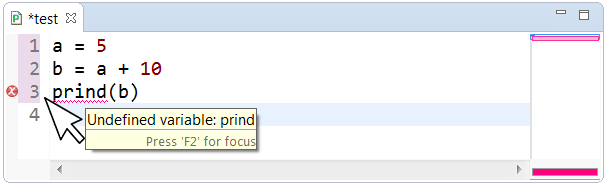
Figure 2 The Eclipse shows an explanation of a syntax error
Debugging logic errors by executing programs step by step
Compared to syntax errors, logic errors are more difficult to find. Since the Eclipse cannot spot and underline logic errors, you are all alone! Let’s look at the following Python program, for example. It prompts the user to enter two numbers and calculates and displays their sum. However, it contains a logic error!
S = 0
a = float(input("Enter 1st value: "))
b = float(input("Enter 2nd value: "))
s = a + b
print("The sum is:", S)
If you type this program into Eclipse, you will notice that there is not even one wavy red line indicating any error. If you run the program, however, and enter two values, 5 and 3, you can see for yourself that even though the sum of 5 and 3 is 8, Eclipse insists that it is zero, as shown in Figure 3.
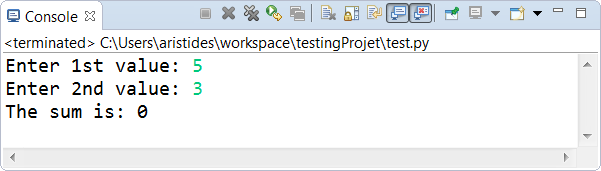
Figure 3 Viewing the result of a logic error in the Output window
What the heck is going on? Of course for an expert programmer, correcting this error would be a piece of cake. But for you, a novice one, even though you are trying hard you find nothing wrong. So, where is the error?
Sometimes human eyes get so tired that they cannot see the obvious. So, let’s try to use some magic! Let’s try to execute the program step by step using the debugger. This gives you the opportunity to observe the flow of execution and take a closer look at the current values of variables in each step.
To open the debugger, you need to open the “Debug” perspective. You can do this by selecting “Window → Open Perspective → Other…” from the main menu. In the popup window that appears, select “Debug” and click on the “OK” button. Now, the Eclipse environment changes a little and looks like the one shown in Figure 4.
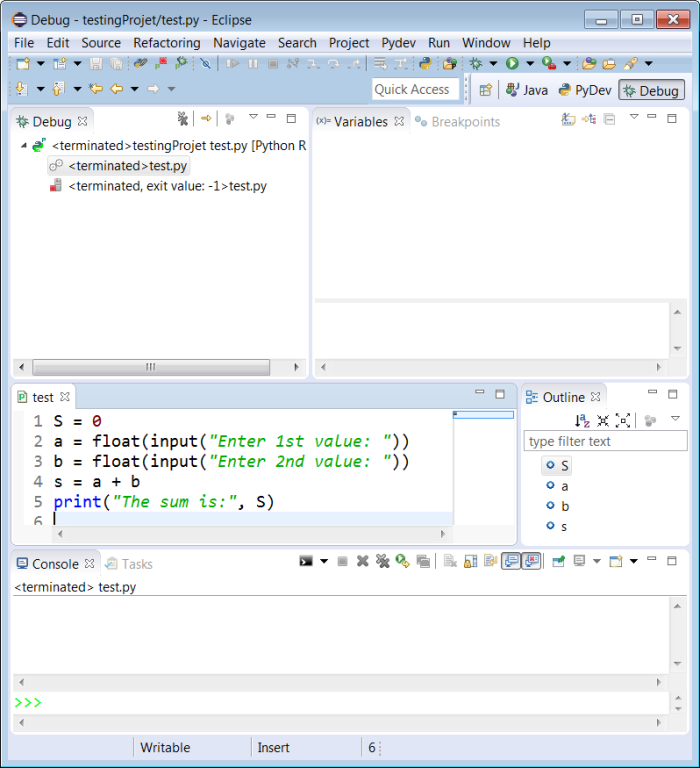
Figure 4 The “Debug” Perspective
Place the cursor at the line where the statement S = 0 exists and hit the SHIFT+CTRL+B key combination. A green icon appears in the gray margin as shown in Figure 5.
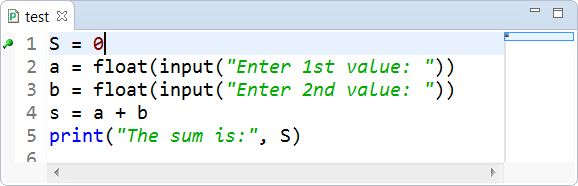
Figure 5 Adding a breakpoint in Eclipse
Start the debugger by selecting “Run → Debug” from the main menu or by hitting the F11 key. By doing this, you enable the debugger and more icons are enabled on the toolbar.
![]()
Click on the “Step Over” ![]() icon on the toolbar or hit the F6 key. The program counter (the blue arrow
icon on the toolbar or hit the F6 key. The program counter (the blue arrow ![]() icon in the gray margin) stops at the first line of the program as shown in Figure 6.
icon in the gray margin) stops at the first line of the program as shown in Figure 6.
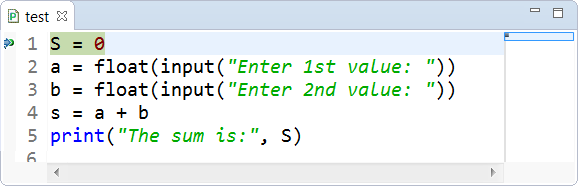
Figure 6 Using the debugger in the Eclipse
Notice: The program counter shows you, at any time, which statement is the next to be executed.
In this step, the statement S = 0 is not yet executed. Click on the “Step Over” ![]() toolbar icon again or hit the F6 key again. Now the statement
toolbar icon again or hit the F6 key again. Now the statement S = 0 is executed, and the program counter moves to the subsequent Python statement, which is the next to be executed.
In the “Variables” window, you can watch all the variables declared in main memory (RAM) and the value they contain during each step of execution as shown in Figure 7.
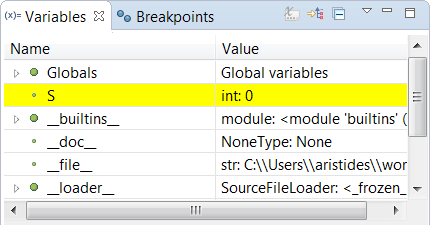
Figure 7 Variables and their values are displayed in the Variables window of the debugger
Click on the “Step Over” ![]() toolbar icon again. The second statement is executed. You can see the output result in the “Console” window (see Figure 8).
toolbar icon again. The second statement is executed. You can see the output result in the “Console” window (see Figure 8).
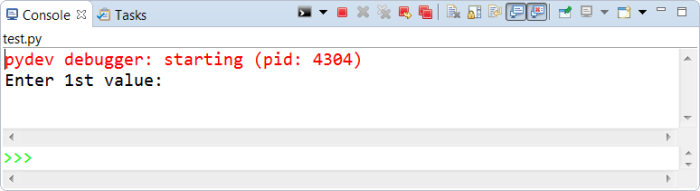
Figure 8 Viewing a prompt in the Output window
In this step, the program waits for you to enter a value. Place the cursor inside the “Console” window, type the value 5, and hit the “Enter ↵” key.
The program counter moves to the third Python statement. Click on the “Step Over” ![]() toolbar icon again. This action executes the third Python statement. Place the cursor inside the “Console” window, type the value 3, and hit the “Enter ↵” key.
toolbar icon again. This action executes the third Python statement. Place the cursor inside the “Console” window, type the value 3, and hit the “Enter ↵” key.
The program counter moves to the fourth Python statement. Click on the “Step Over” ![]() toolbar icon once again. The statement
toolbar icon once again. The statement s = a + b is executed. What you expected here was the sum of 5.0 and 3.0, which is 8.0, to be assigned to variable S with a capital S. Instead of this, the value 8.0 is assigned to the variable s, as shown in Figure 9.
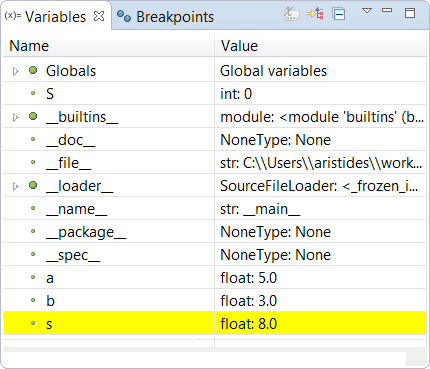
Figure 9 All declared variables are displayed in the Locals window of the debugger
Now it becomes more obvious to you! You mistakenly declared two variables in the main memory (RAM), the variable s and the variable S with a capital S. So, when the flow of execution goes to the last statement, print("The sum is:", S) the value 0 instead of the value 8 is displayed.
Congratulations! You have just found the error! Click on the “Terminate” toolbar icon to cancel execution, correct the error by changing variable S to s, and you are ready! You just performed your first debugging! Re-execute the program and you will now see that it calculates and displays the sum correctly.
Debugging logic errors by adding breakpoints
Debugging step by step has a big disadvantage. You have to click on the “Step Over” ![]() toolbar icon again and again until you reach the position where the error might be. Can you imagine yourself doing this in a large program?
toolbar icon again and again until you reach the position where the error might be. Can you imagine yourself doing this in a large program?
For large programs there is another approach. If you suspect that the error is somewhere at the end of the program there is no need to debug all of it right from the beginning. You can add a marker (called a “breakpoint”) where you think that the error might be, execute the program and when flow of execution reaches that breakpoint, the flow of execution will pause automatically. You can then take a closer look at the current values of the variables at the position where the program was paused.
Notice: When the program pauses, you have two options for resuming the execution: you can add a second breakpoint somewhere below in the program, click on the “Resume”
toolbar icon, and allow the program to continue execution until that new breakpoint; or, you can just use the “Step Over”
toolbar icon and execute the program step by step thereafter.
The next Python program prompts the user to enter two values and then it calculates their sum, their difference, and their average value.
However, the program contains a logic error. When the user enters the values 10 and 12, the value 16, instead of 11, is displayed as the average.
a = float(input("Enter 1st value: "))
b = float(input("Enter 2nd value: "))
s = a + b
d = a - b
average = a + b / 2
print("Sum:", s)
print("Difference:", d)
print("Average:", average)
You suspect that the problem is somewhere at the end of the program. However, you do not want to debug the entire program, but just the portion in which the error might be. So, let’s try to add a breakpoint at the d = a - b statement (see Figure 9–10). There are two ways to do this: you can double click in the left gray margin on the corresponding line, or you can place the cursor at the line of interest and hit the SHIFT+CTRL+B key combination.
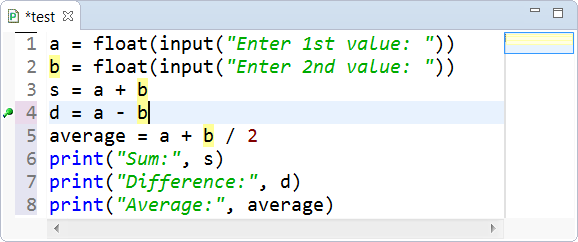
Figure 9–10 Adding a breakpoint to a program
Notice: You know that a breakpoint has been set when the green icon appears in the gray margin on the corresponding line.
Make sure that the “Debug” perspective is open and hit F11 to start the debugger. Enter the values 10 and 12 when requested in the output window. You will notice that just after you enter the second number and hit the “Enter ↵” key, the flow of execution pauses at the breakpoint (the corresponding line has green background highlighting it.)
Remember! You can debug a program by selecting “Run
→Debug” from the main menu or by hitting the F11 key.
Now you can take a closer look at the current values of the variables. Variables a, b, and s contain the values 10.0, 12.0, and 22 respectively, as they should, so there is nothing wrong so far, as shown in Figure 9–11.
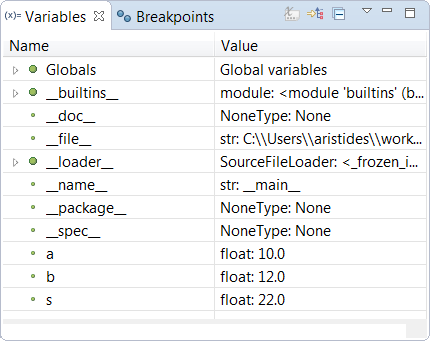
Figure 9–11 Viewing the current values of the variables in the Variables window
Click on the “Step Over” ![]() toolbar icon once. The statement
toolbar icon once. The statement d = a – b executes and variables a, b, s and d contain the values 10.0, 12.0, 22.0, and -2.0 respectively, as they should, so there is still nothing wrong so far, as shown in Figure 9–12.
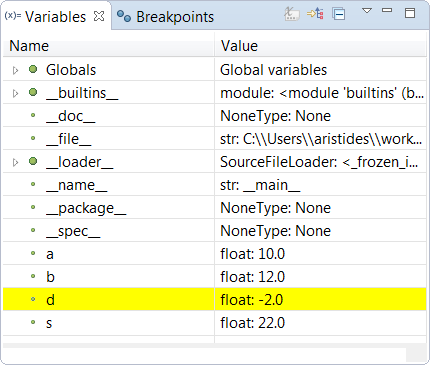
Figure 9–12 Viewing the current values of the variables in the Variables window
Click on the “Step Over” ![]() toolbar icon once again. The statement
toolbar icon once again. The statement average = a + b / 2 executes and variables a, b, s, d, and average contain the values 10.0, 12.0, 22, -2, and 16 respectively, as shown in Figure 9–13.
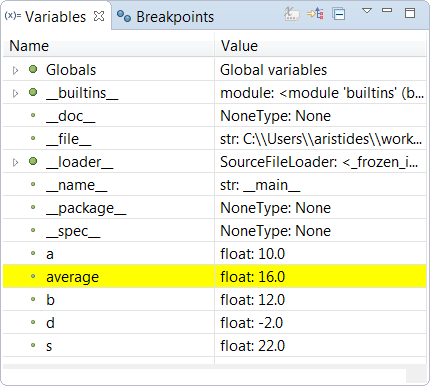
Figure 9–13 Viewing the current values of the variables in the Variables window
There it is! You just found the statement that erroneously assigns a value of 16.0, instead of 11.0, to the variable average! And now comes the difficult part; you should consider why this happens!
After two days of thinking, it becomes obvious! You had just forgotten to enclose a + b inside parentheses; thus, only the variable b was divided by 2. Click on the “Terminate” ![]() toolbar icon, remove all breakpoints, correct the error by enclosing
toolbar icon, remove all breakpoints, correct the error by enclosing a + b inside parentheses and you are ready! Re-execute the program and see now that it calculates and displays the average value correctly.
Notice: You can remove a breakpoint the same way you added it: double click in the left gray margin on the corresponding line number, or place the cursor at the line that contains a breakpoint and hit the SHIFT+CTRL+B key combination.